Search for answers or browse our knowledge base.
Dashboard
Overview
The dashboard provides the Admin with a quick snapshot of Campaign data. The data displayed is for all the campaigns that were created (both Active and Ended campaigns). In this interactive dashboard, admin can drill down by clicking each button. For example: Clicking the “Active Campaigns” will provide you more information on all the Active Campaigns.
Dashboard Contents
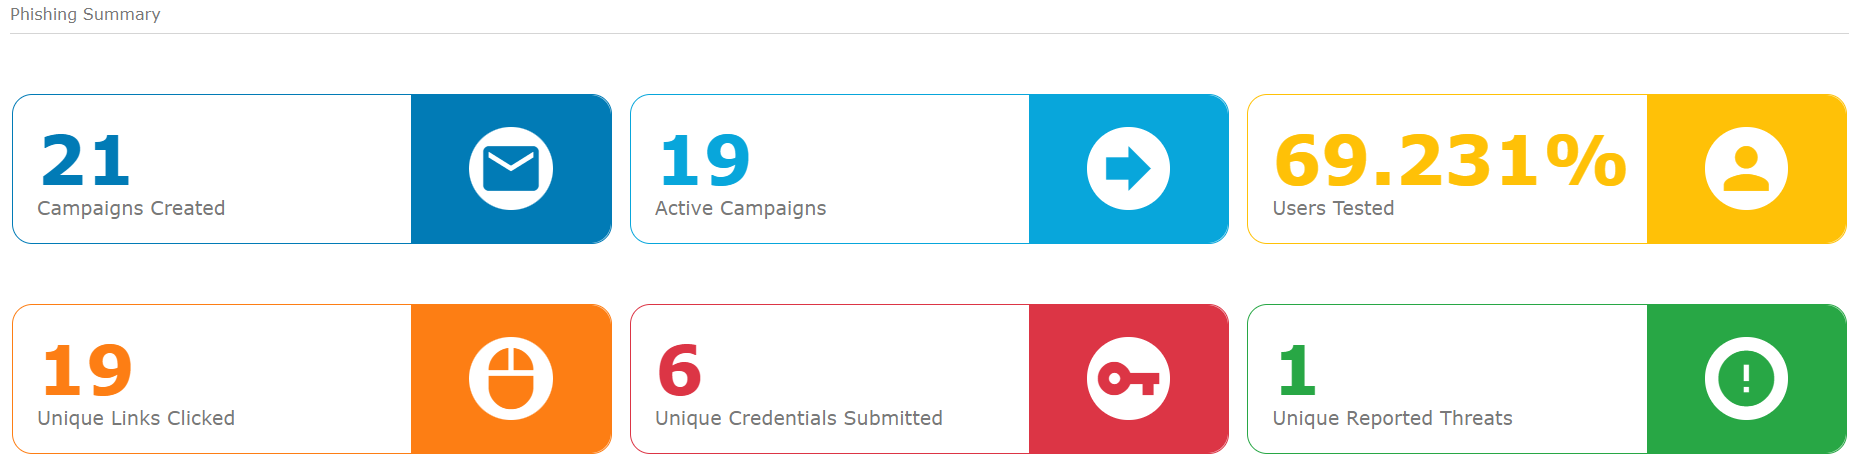
Campaigns Created
This tile displays the total number of Campaigns that were created. The data shown includes both Active and Ended campaigns. Clicking this tile will take you to the Reports page which provides information of all the Campaigns created.
Active Campaigns
This section displays the total number of Active Campaigns. Clicking this section will take you to the Reports page which provides information on all the Active campaigns.
Users Tested
As an admin you would want all the users in the organization to be tested. This tile helps you in knowing the percentage of the users who were tested by PhishNxt. Clicking this tile will take you to the Reports page which provides information on all the users that were tested.
Unique Links Clicked
The tile displays the total number of unique clicks for the links that were sent to the target users. Note that this section shows only unique clicks. For example: If a user has clicked a link 10 times, the data in this section will consider only the unique click and the count will be 1. Clicking this tile will take you to the “Clicked Links” section of the Reports page.
Note: The total number of times a user has clicked a link can be seen from the Reports page for Users. You can find more information on this in the Reports section.
Unique Credentials Submitted
The section displays the total number of times the users have submitted their credentials. Note that this section takes into account only unique data. For example: If a user has submitted his credentials 10 times by clicking the same link, the data in this section will consider only the first time and the count will be 1. Clicking this section will take you to the “Submitted Data” section of the Reports page.
Note: The total number of times a user has clicked a link can be seen from the Reports page for Users. You can find more information on this in the Reports section.
Unique Reported Threats
The section displays the total number of times the users have reported the Phishing Campaign mails that were sent to them. Note that this section takes into account only unique data. For example: If a user has reported a single mail 10 times, the data in this section will consider only the first time and the count will be 1. Clicking this section will take you to the “Emails Reported” section of the Reports page.
Note: The total number of times a user has clicked a link can be seen from the Reports page for Users. You can find more information on this in the Reports section.