Search for answers or browse our knowledge base.
Accessing the Report Dashboard
This document provides guidance on interpreting user course data displayed on the report screen.
To get started, log in to the eLearning Portal. Now, select Report from the menu bar at the top, followed by choosing Dashboard from the menu bar below that. 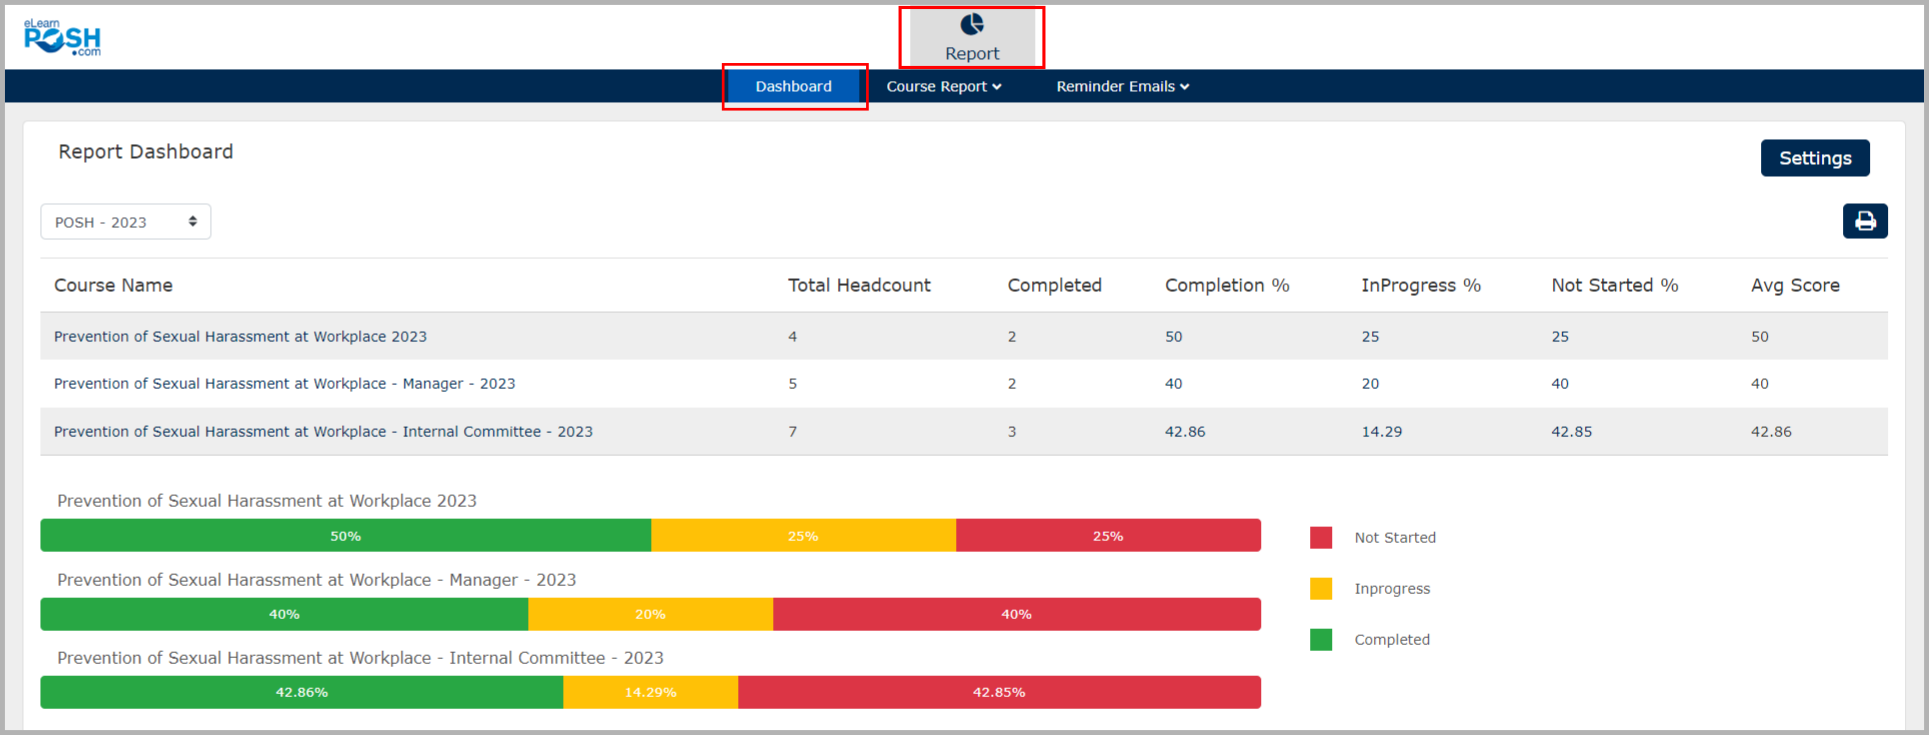 Now there are 2 ways to view user list information
Option 01: Click on the numbers below the Completion%, In Progress% or Not Started% of respective courses to get more information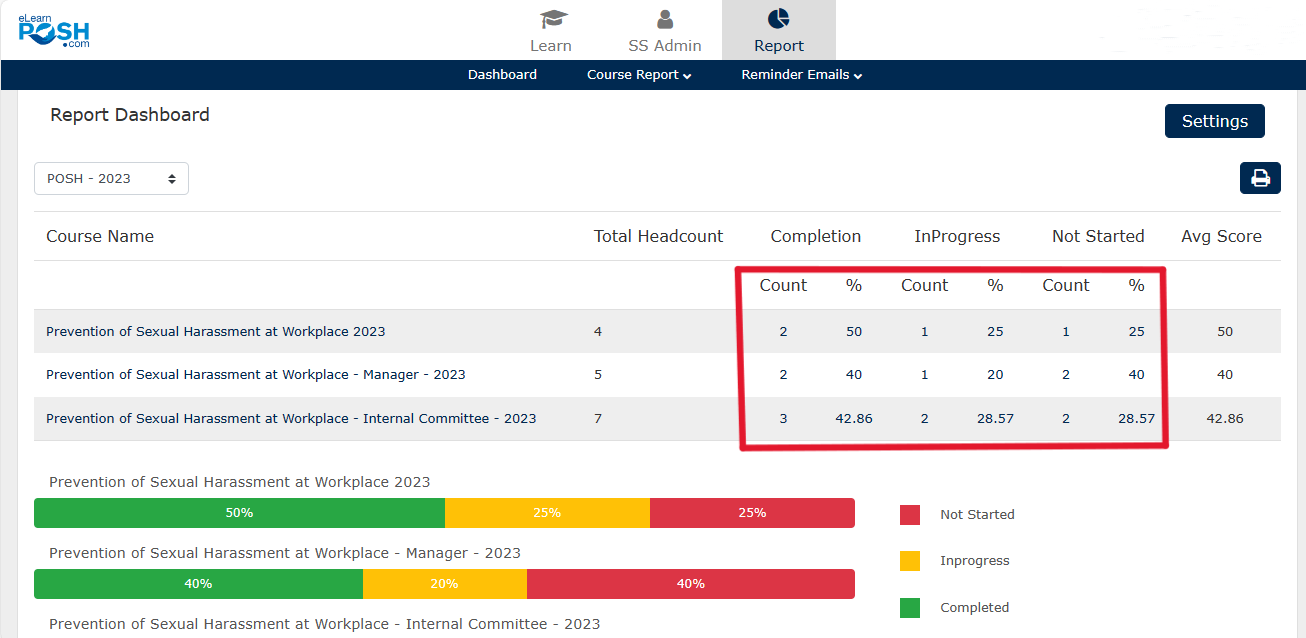
Option 02: Select the Green/Yellow/Red graph to view the list of “Completed”, “In Progress” or “Not Started” user list respectively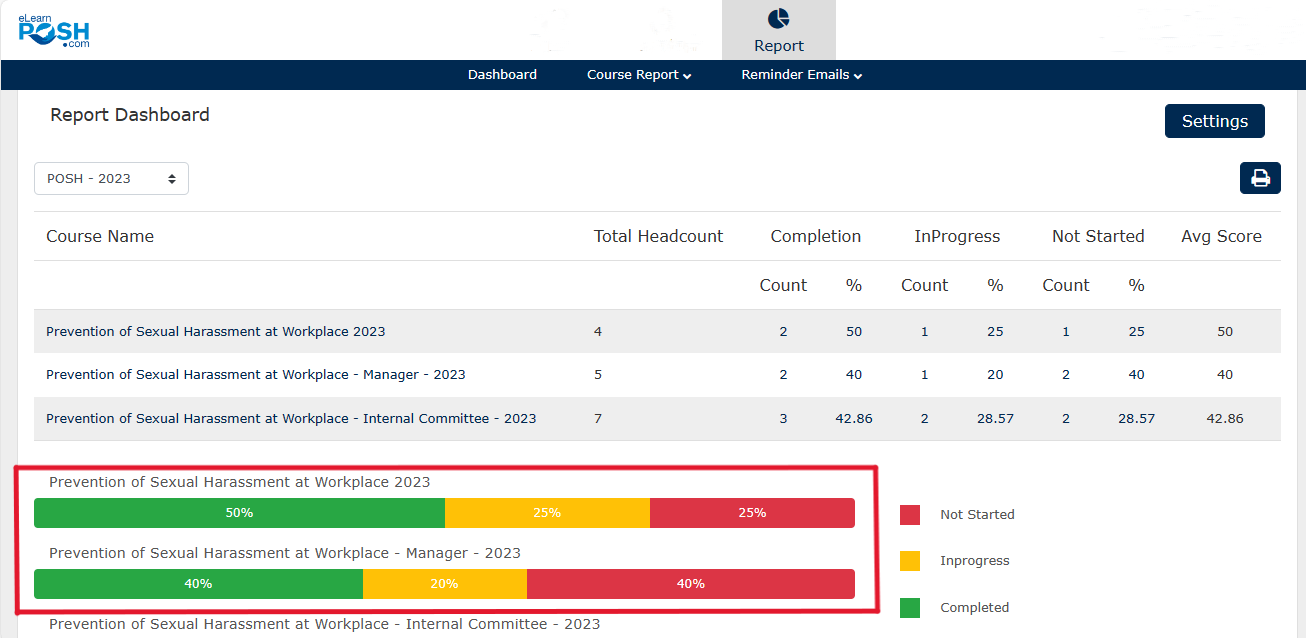 Then Click on the “CSV” button to download the list as an Excel sheet
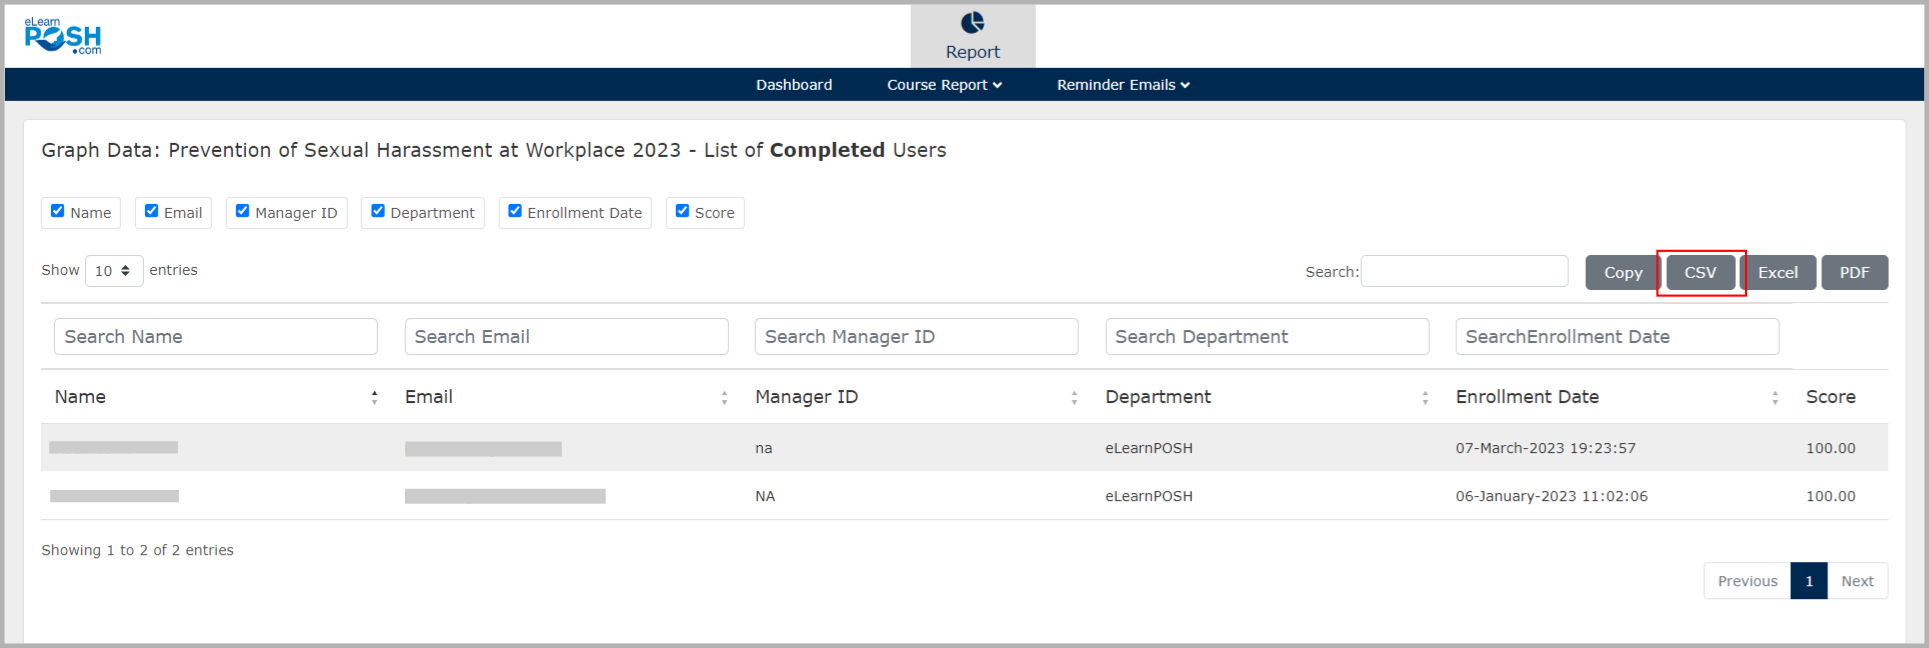 Note: Our LMS provides the “Real-time data” when you download the reports.